Stress testing your financial plan.
A financial plan is important to build the roadmap to reach your financial goals in the short, medium, and long term. Its success depends on your ability to spend no more than you can afford. This applies to whatever level of wealth you have. It's that simple, but, and you know there's a but, financial planning seems hard because of the uncertainties that arise.
Life happens. A job loss, a market crash, a roof leak, divorce, disability, death, etc. can leave you or your loved ones in a dire situation. The only thing that’s certain is uncertainty, so we should plan for that. Proper insurance, and keeping emergency funds, can minimize the impact of many of these catastrophic unexpected events. Having a diversified portfolio of investments also reduces the chances of it being wiped out. Having these in place gives you control over some of those uncertainties.
This still leaves a lot of uncertainty over which we have no control. Inflation, interest rates, and the return on financial investments are among them. In the MoneyReady App, we provide several tools for stress-testing your financial plan in the face of that uncertainty. First, you can set the inflation rate and all of the rates of return now and for any future dates. Play with it. What do you think will happen? See what it does to your plan. But we also provide methods that automate the process of varying rates.
Simulating market crashes
You can tell the MoneyReady App to crash the equity market anytime you like. This is useful to crash it right before your retirement, for example, and that way make sure your plan still works. Let's consider an example of a user that is planning retirement at 65 in just a few years. We'll call her Nervous, because after running her plan, expecting to live to 90, her net worth is lower than she would like (Figure 1). All values shown are in today’s dollars, so adjusted for inflation.
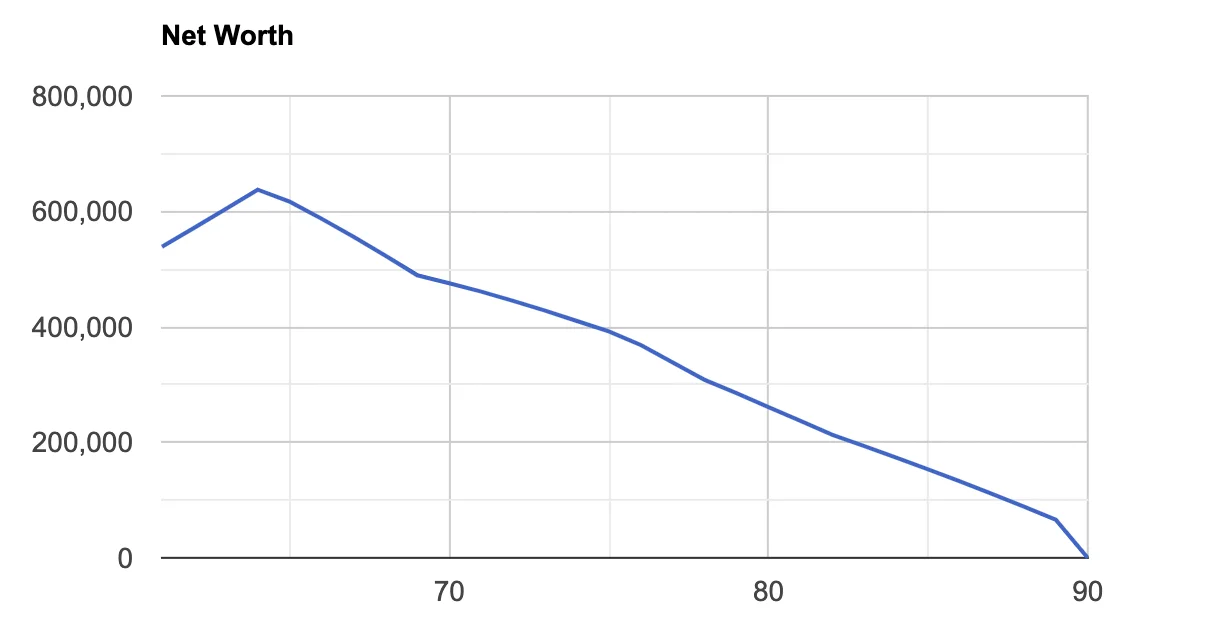 Figure 1.
With a market crash of 50% at retirement that takes 6 years to recover, and will leave her broke at 87 (Figure 2).
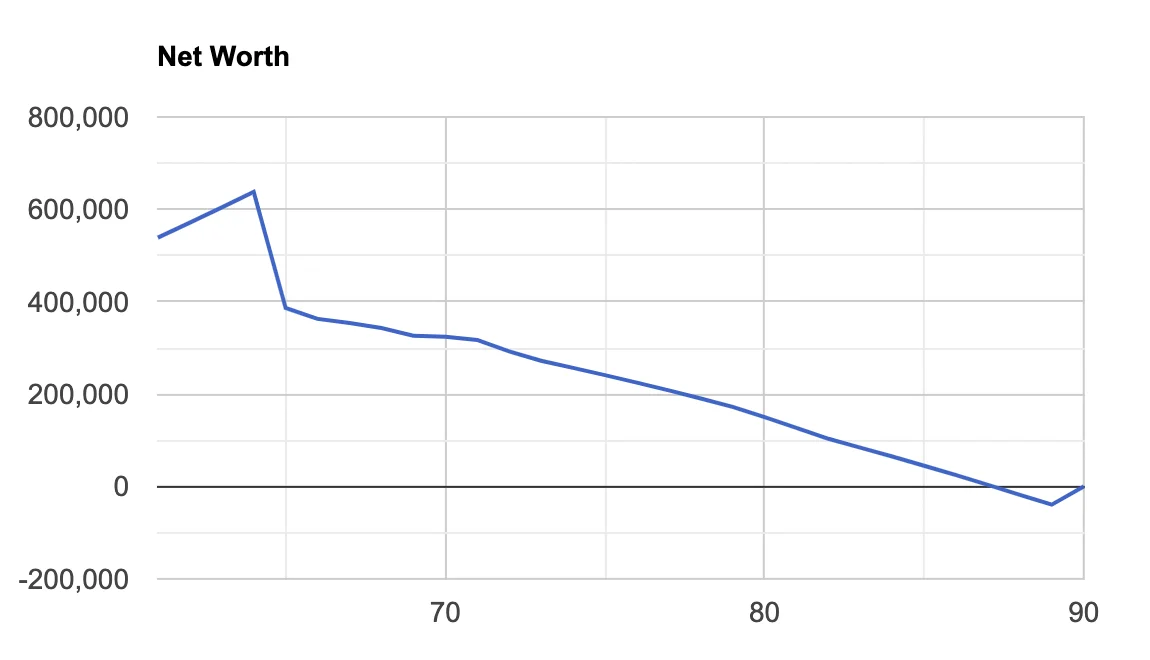 Figure 2.
Similarly, with 20% downturns every 10 years that each takes 3 years to recover (Figure 3).
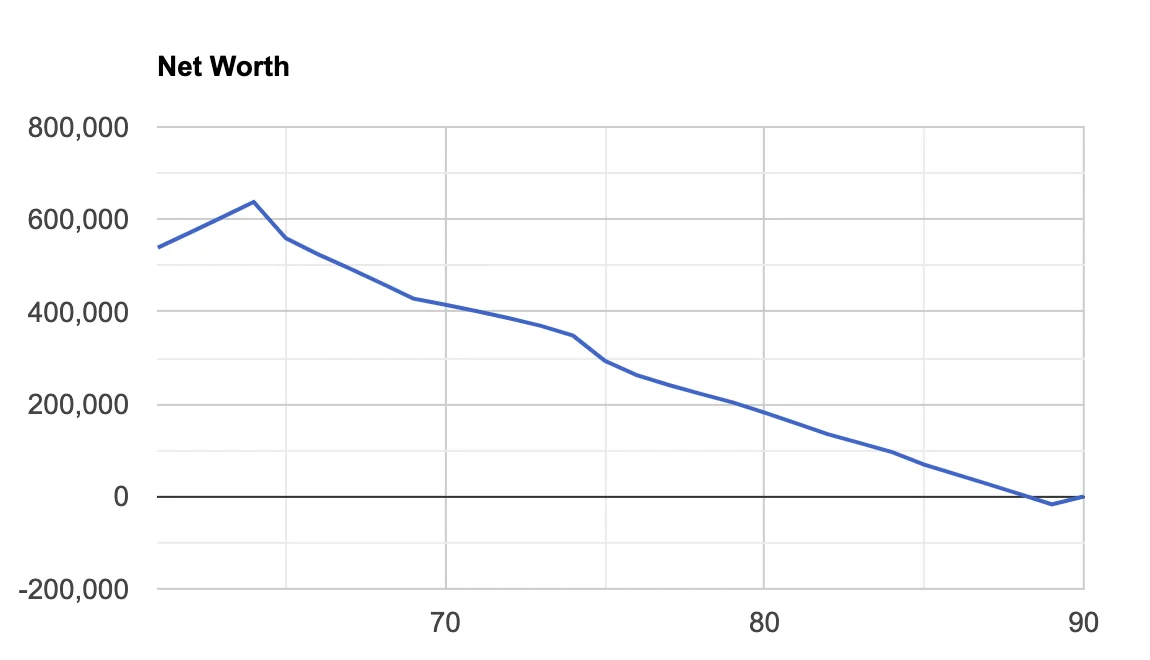 Figure 3.
She might still be ok because her set expected rates of return were already set lower than the historical average. But given that she is Nervous, she may want to reduce her exposure to equities. Let’s investigate some more.
Monte Carlo Simulations
You can run Monte Carlo simulations of your entire plan. Monte Carlo simulations use a statistical model built from historical data of market values and their correlations, to generate paths in time of the market variables. We run random samples from the model so that you get an approximation of the probability of success of your financial plan. It's only an approximation, as the model may not fully reflect future reality even statistically (as they say, past performance is no indication of future returns). Nevertheless, a good model can give you an idea of the range of what could happen to your plan. We use a model originally developed by the Society of Actuaries
It considers:
- The performance of high-cap and low-cap stocks with regime switching between low-volatility and high-volatility periods of equity returns to capture the fat tails of the equity return distribution that have been observed historically.
- Stock dividend yields.
- The unemployment rate, inflation, short-term and long-term interest rates, and the shape of the yield curve.
- The correlations between all of these variables.
- In addition, we've added a model for the USD/CAD exchange rate which will affect any USD investments, but also any incomes, expenses, savings, and loans entered in U.S. dollars.
This comprehensive model thus allows us to set simulated rates for your investments in cash, fixed income, and equities. It will set rates for variable and fixed-rate loans (at loan renewals). It will set the inflation rate that will affect all things that are set to be indexed with inflation in your scenario (incomes, expenses, and real estate for example), and tax brackets.
You can run 100 market model simulations with the MoneyReady App TIME MACHINE in a click of a button. We then present you with a table for your end-of-life financial legacy. The values are shown for your regular input scenario (no simulation), followed by the minimum, the 10%, 25%, 50% (median), 75% and 90% quantiles, and the maximum of the values obtained with the simulated rates (Table 1). These data are also presented as a box plot (Figure 4).
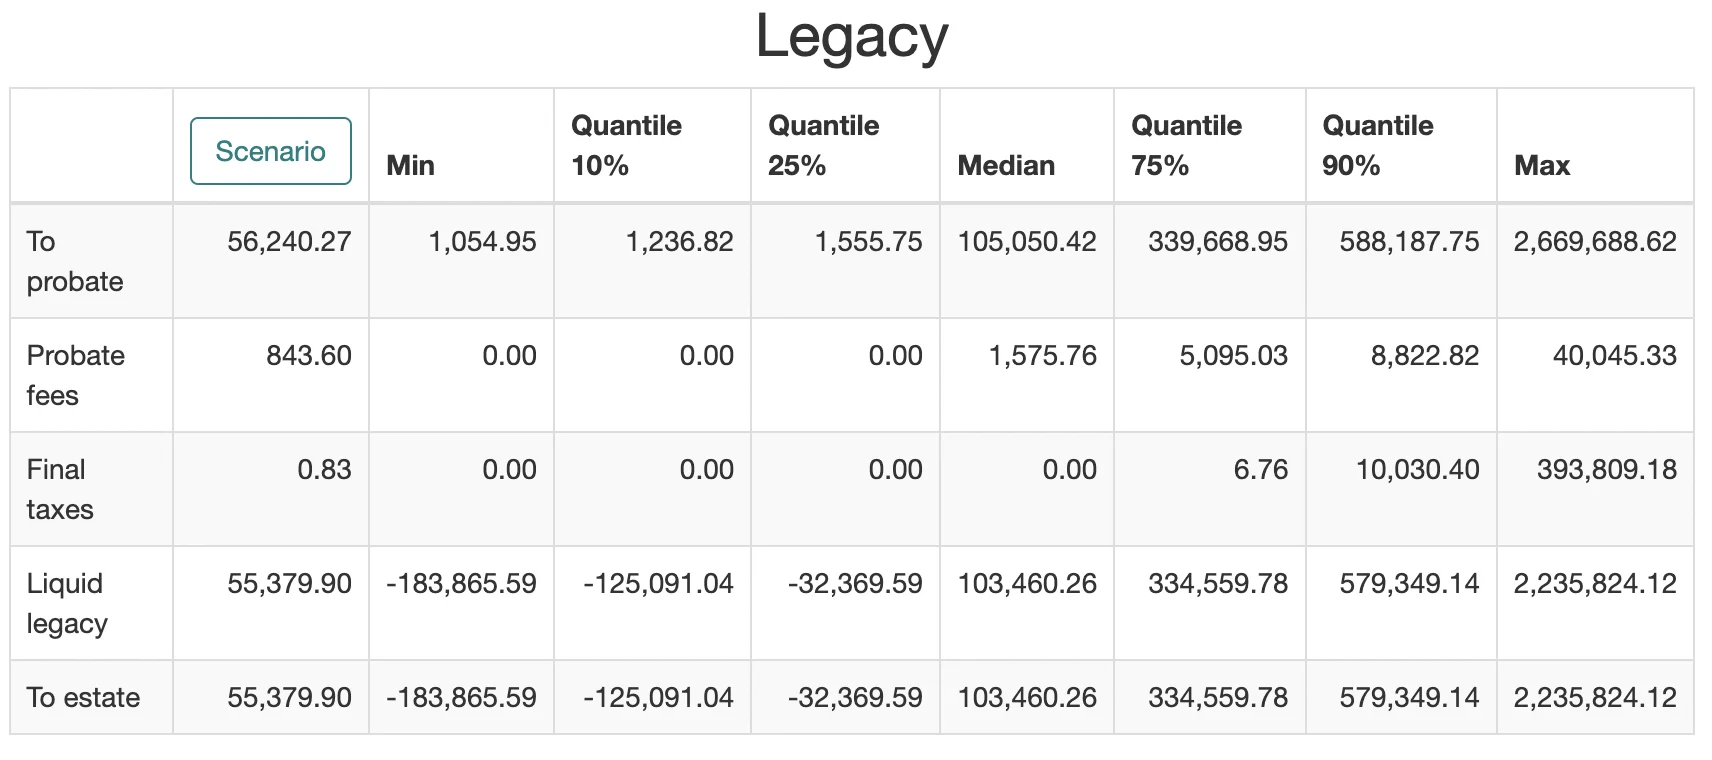 Table 1.
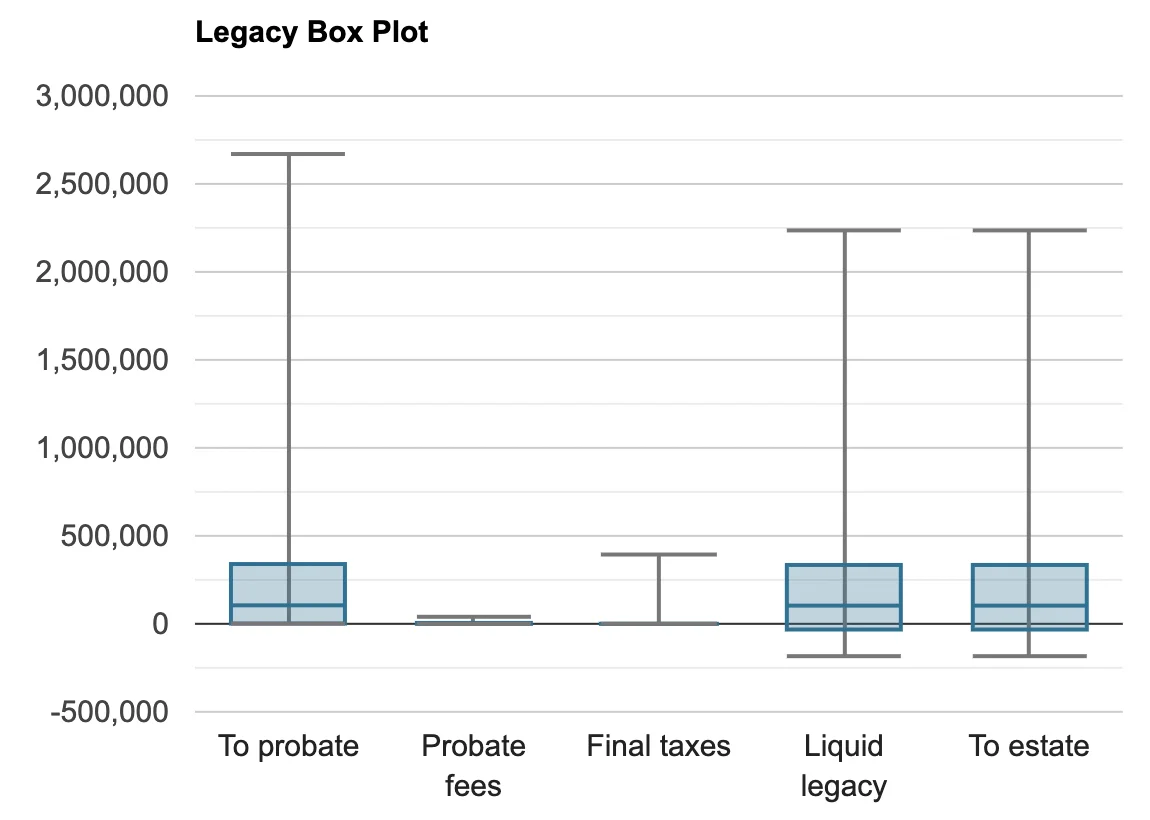 Figure 4.
Additional graphs plot the median value for the 100 simulations. In dark shading around the median are the 25% to 75% quartiles, and the min and max areas are shown in lighter shading. In this manner, we show your net worth (Figure 5), and your wallet balance (Figure 6), for every year. These graphs thus show the variability that can be expected in these values for your plan. The results of your own scenario are also shown (red line), this can indicate to you how optimistic or pessimist your set rates are compared to the model's assumptions. In Nervous’s case, the red line is below the median thus her assumptions are pessimistic as I mentioned earlier, but not by that much since it is still above the 25% quartile.
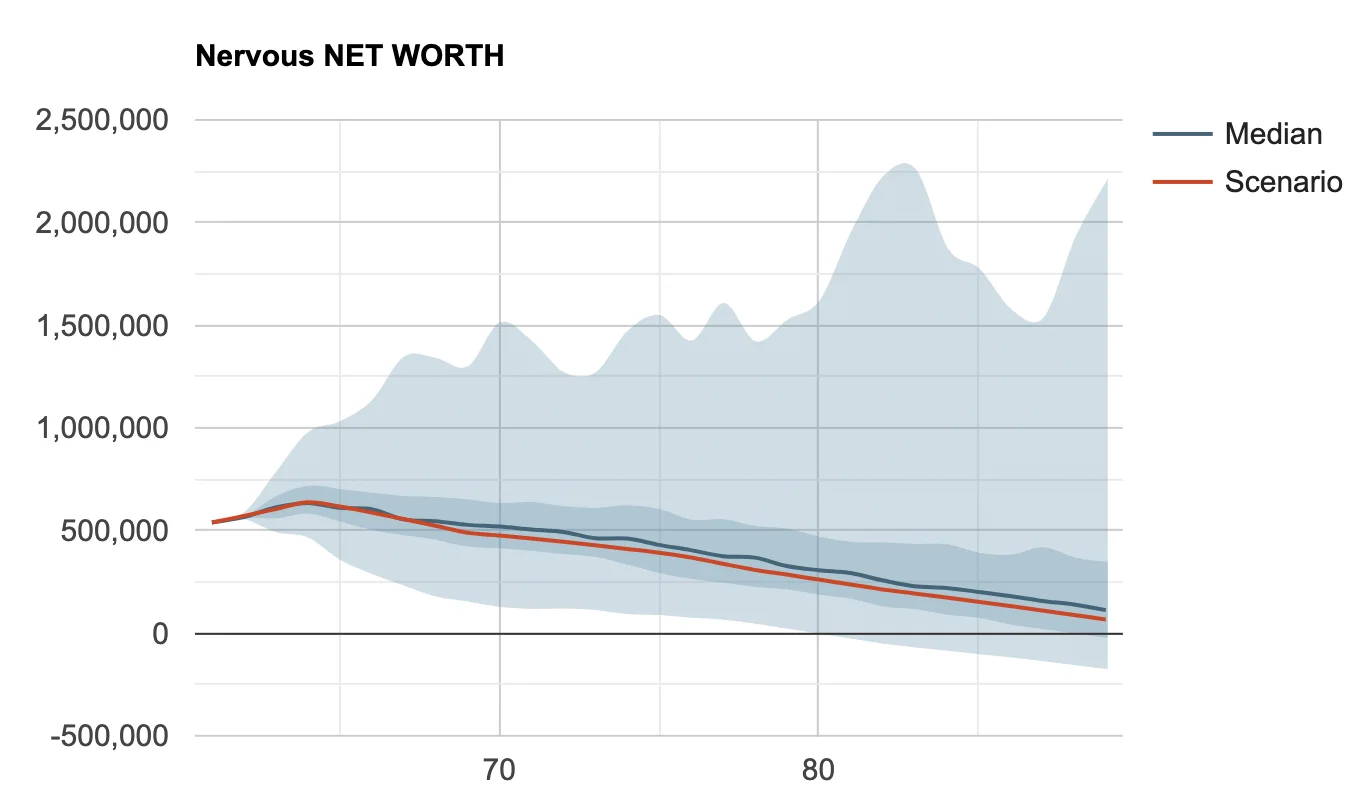 Figure 5.
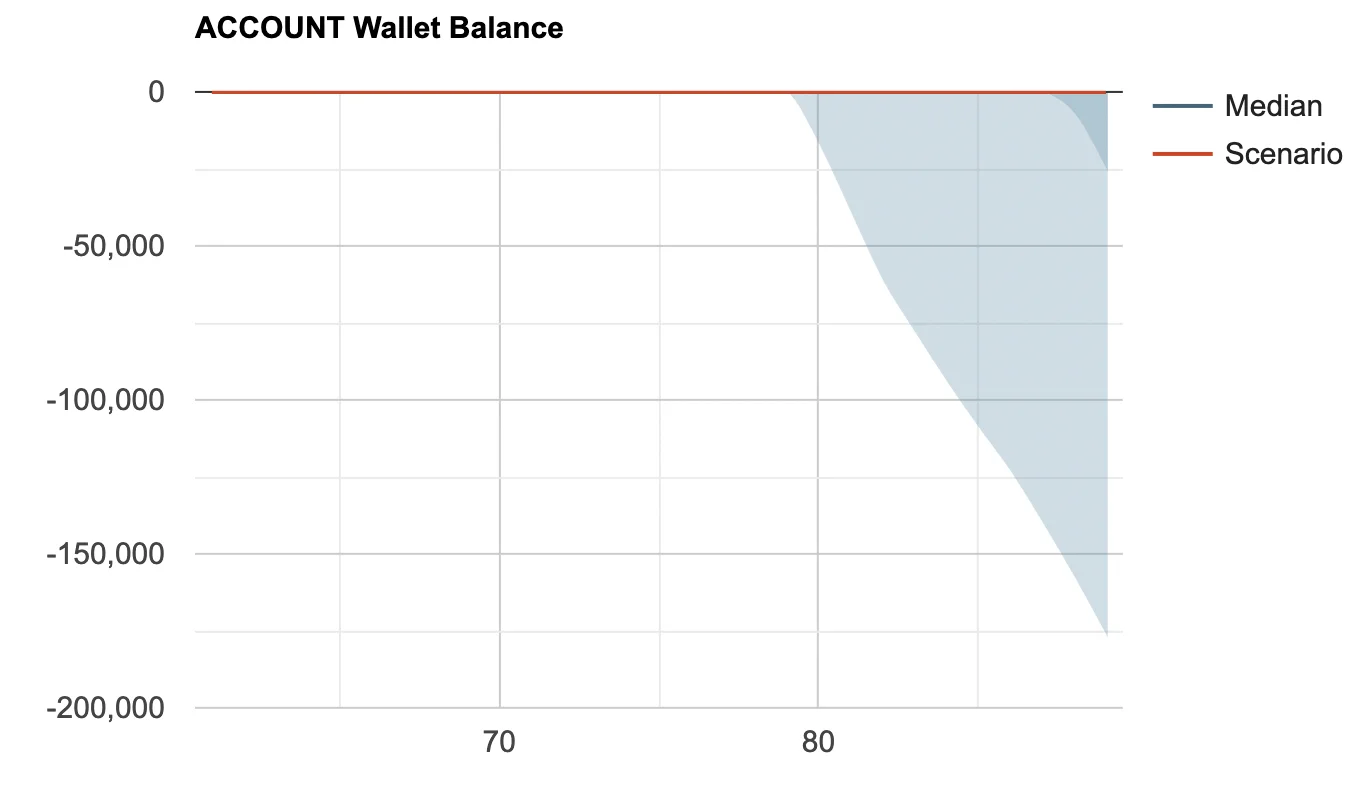 Figure 6.
If you see dark shading below zero in any of these graphs, your plan may be at risk, and you should consider reducing expenses or increasing income. The Wallet graph is particularly interesting. If you run out of money in the TIME MACHINE, it does not stop, it will instead give you a loan from a fake account we call your "Wallet". The loan must be paid back the following year. If you see the wallet account dip below zero in a portion of the simulations, this indicates years that you may be at risk for running into cash-flow problems.
As you see from this example, the simulations show you not only the downside risk but also the upside potential. Don't let the large tail on the upside of the values go to your head. Plan for the worst and hope for the best. In Nervous’s case, with the current asset allocation of her portfolio, there is some risk of running out of money after the age of 80. However, that is a long time from now, and there is quite a bit of upside variability until then. She has time to monitor and adjust.
Your plan is available to revise 24/7, it's not static, you can run it yourself any time the market changes, your situation changes, or tax rules change. Peering into the long-term future like this gives you time to adapt your plan to be more resilient in the face of uncertainty.